
Back in the year 2006, according to China’s Ministry of Human Resources and Social Security, 43% of Chinese workers over the age of 65 (and 67% of women) had never attended school.1 Another 47% had only a primary school education.2 3
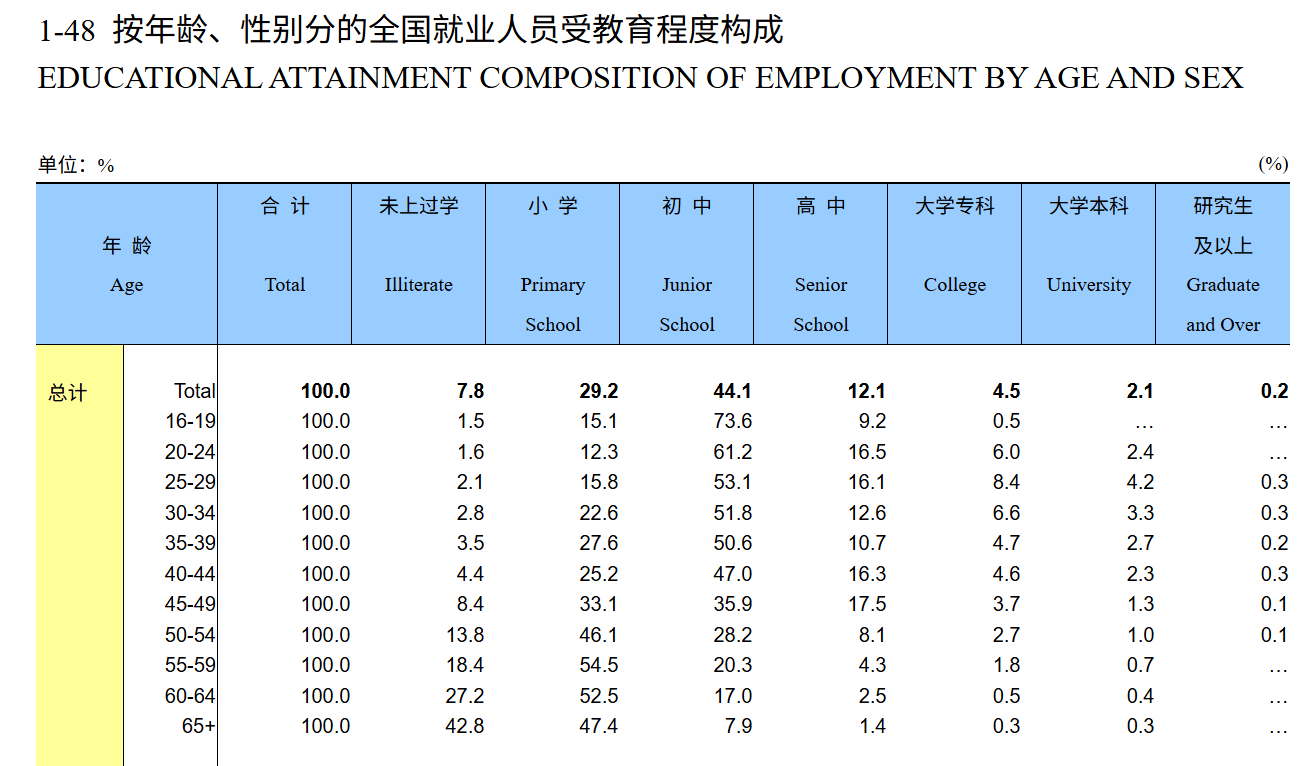
By 2022, however, the numbers had improved drastically, with only 14.3% of Chinese workers aged 65+ not having completed primary school.4
What happened? Did tens of millions of Chinese elders go back and complete primary school in their old age? Of course not. Sixteen years had passed since 2006. People aged 65+ in 2006 were now 81+, and many of them had aged out of the population entirely, while those entering this cohort were much more likely to have received a primary school education. The structure of the group itself had changed.
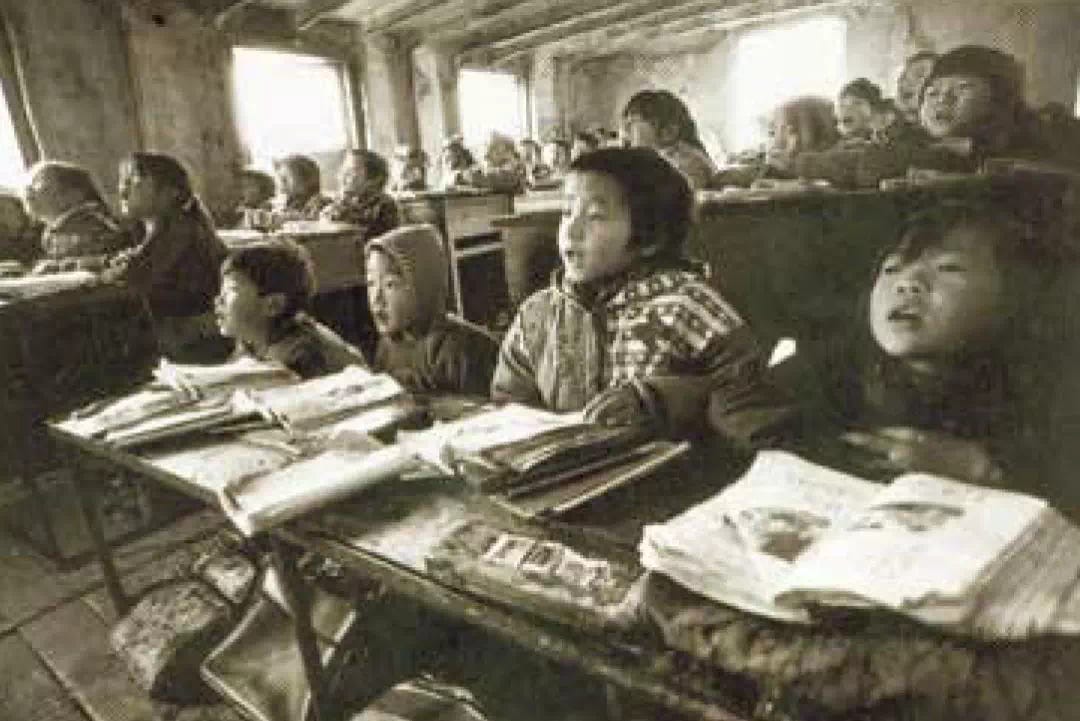
To have been 65 in 2006 means you were born in 1941 into Nationalist China at war with Japan. Your primary school years were roughly 1946-1952, tumultuous years of civil war in which the Nationalist government was overthrown by the Communist Party and the nascent People’s Republic established.
On the other hand, to have been 65 in 2022 means you were born in 1957 into Mao-era China. Your primary school years overlapped with the Cultural Revolution, which disrupted education throughout the country, especially in 1966-68. However, the worst disruptions were for secondary education and universities, while primary education enrolment actually expanded during the period.5 This China saw substantial gains in basic literacy and primary school access, even as secondary school completion rates plummeted - both of which are visible in the demographic record decades later.
These two Chinas are already very different. But neither remotely resembles the China of 2022, where only 0.3% of people aged 16-20 had failed to complete primary school and almost 50% of young people went on to post-secondary education.6

What happens if all three of these population cohorts are compressed into a single national aggregate statistic of educational attainment? Which demographic is the most representative? Are any of them?
The Compressed Demographic Transition
These questions illustrate one of the more obvious consequences of what Chinese demographic researchers call the “compressed demographic transition” 压缩式人口转变.7 Over the last seventy years, China’s economy and society have changed so much, and so rapidly, that constituent cohorts of its population grew up in functionally different countries. Accordingly, they reflect welfare outcomes from very different stages of development. For national aggregate statistics, these cohorts are averaged together. This yields averaged indicators that are statistically accurate, but often fail to describe the conditions experienced by any single generation particularly well.
Educational attainment illustrates the mechanism clearly because it is straightforward to assess in population surveys. But the same logic applies to indicators as diverse as height, civic behavior, or wealth. Just as you usually cannot go back to attend primary school in your retirement, a retired person cannot benefit from accumulated wealth they never had the opportunity to earn, nor can they draw pension income from decades of contributions they never had the opportunity to make. Experiences in early life cast a long shadow.
Consider the current 65+ generation in China, comprising an estimated 200 million people. Someone 70 years old today was born in 1956. Their childhood nutrition was heavily influenced by the conditions of the Great Leap Forward. They were 10 years old when the Cultural Revolution began and higher education was disrupted (basic literacy rates continued to rise, but fewer than 5% went on to secure a high school diploma).8 They spent their 20s and part of their 30s in the late planned economy and early reform era. They turned 45 in 2001, just in time for China’s WTO accession, at which time China’s GDP was growing rapidly, but still slightly smaller than France’s. As urban employees, they may have retired around 2011-2016.9 However, if they are from rural areas, they are possibly still engaged in informal/agrarian labor today.
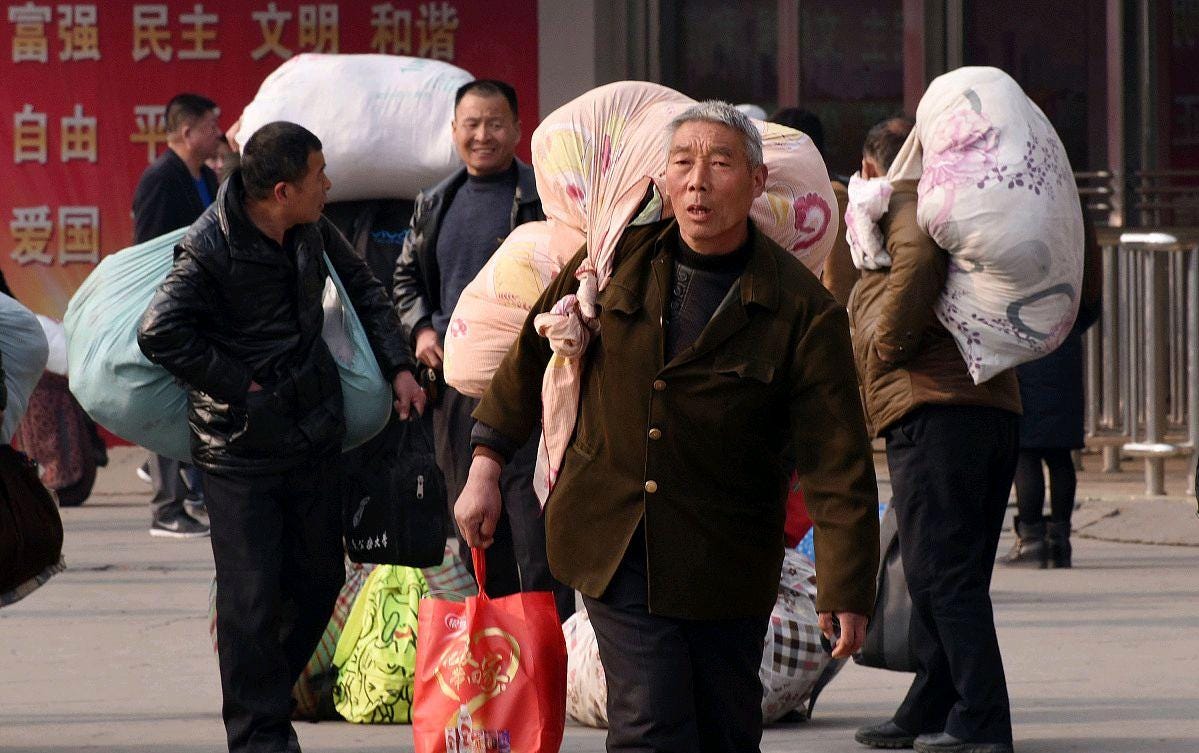
In other words, they grew up amid varying degrees of famine conditions, missed out on most of their formal schooling, spent their early working years in a sputtering late-stage planned economy, and then dedicated their most economically productive and mature years to a poor, early-reform China. They contributed to and enjoyed a taste of the country’s spectacular post-reform economic and social development near the end of their formal working lives, then retired - if they could afford to.
Consequently, many entered retirement with fewer assets, lower pension entitlements, and much less financial security than younger cohorts can expect to achieve. Aside from their modest personal savings, they are mostly reliant on their families - or the state - for healthcare, eldercare, and general welfare, which is why they are also the object of a great deal of domestic Chinese research assessing their needs.
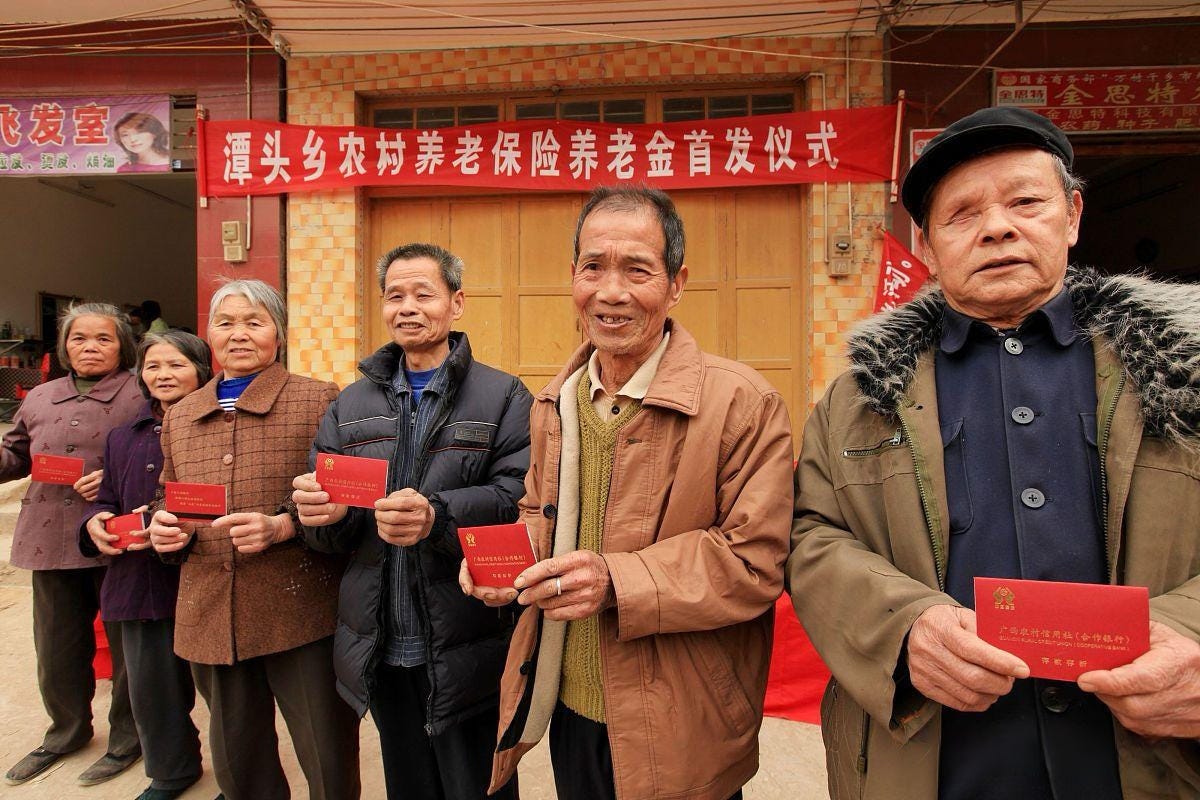
Because these cohorts remain numerically substantial, their life outcomes continue to shape national averages. They have lower incomes. They have less wealth. They received less schooling. They’re shorter. They represent the statistical outcomes of the past, and there’s surely methodological merit in demarcating their outcomes from those of younger generations. Chinese demographers and statisticians are of course aware of this - that’s surely part of why they report so much welfare data broken down by cohorts.10
Human societies typically contain four or more living generations at once, and China still contains hundreds of millions of people whose childhoods and early working lives were shaped by pre-reform conditions. When one cohort replaces another, aggregate measures of wealth, income, and retirement security can improve through demographic replacement alone. This process will continue for decades in China. The practical and statistical effects of the current 65+ cohort won’t change much until they mostly age out of the data, and the cohort is refilled with the post-reform demographic instead. In other words, national averages will become fully representative of modern China when all living generations were themselves raised in modern China.
It’s Not That Unique: South Korea’s Earlier Transition
This compressed demographic phenomenon is not limited to China. Actually, it can and should appear in any country where economic growth is rapid enough to create large welfare gaps between successive generations still alive at the same time.
South Korea is a useful leading case here. If we date Korea’s modern economic take-off to the launch of its first Five-Year Economic Development Plan in 1962, then South Korea circa 2010 was as far removed from the beginning of its development boom as China today is from the dawn of reform in 1978. But 1978 is not necessarily the most useful starting point for this discussion. If we instead define China’s modern growth model according to the boom in urban employment, private enterprise, and housing wealth following Deng’s Southern Tour, then 1992 becomes the more relevant benchmark. By that signpost, the best demographic analogue for China today in a cohort-composition sense is not South Korea in 2010, but South Korea in 1996.11
The South Korea of 1996, much like the China of today according to the 1992 clock, was a country more than three decades into its modern growth model. Younger generations were already enjoying the fruits of their country’s rapid industrialization, while the country still held large older populations whose formative and wealth-building years occurred in a much poorer society.

These similarities in cohort composition between 1996 Korea and 2025 China are useful, albeit imperfect. On a real GDP per capita basis, China today still lags South Korea in the mid-1990s: Korea’s 1996 GDP per capita was about US$14,900 in constant 2015 dollars,12 compared with China’s roughly US$13,800 in 2025.
On other indicators, China today is already ahead of 1996 South Korea, for example, life expectancy at birth: Korea’s life expectancy in 1996 was about 74.2 years, while China’s was 78 years in 2024.13 The point remains though: despite robust economic growth experienced by younger generations, Korea in 1996 and China in 2025 were both contemporary upper-middle-income economies bearing the statistical legacy of much poorer historical cohorts. 14
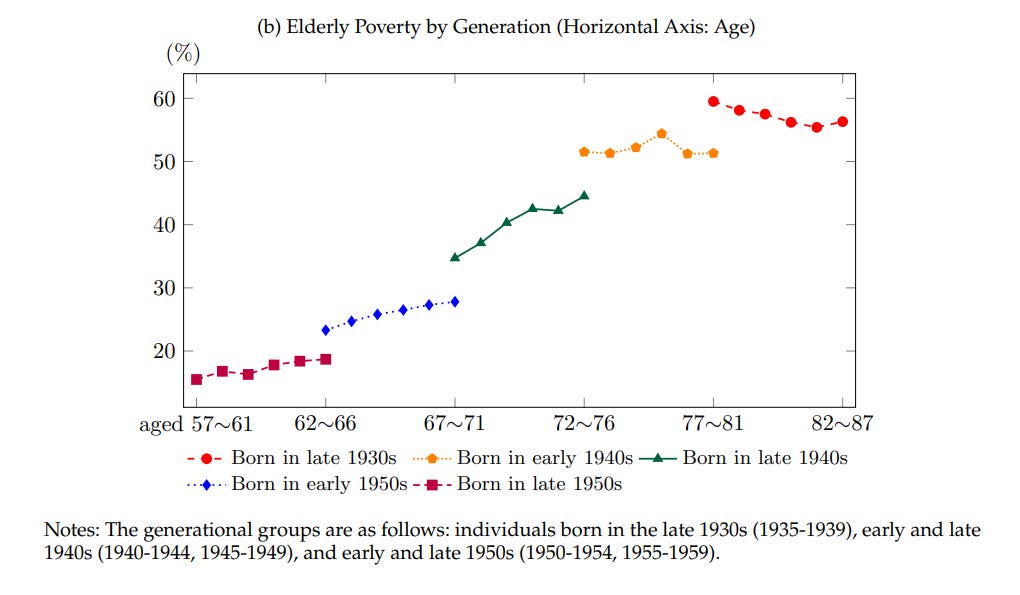
Three decades later, most statistical traces of that older Korea have faded from the aggregate data, but not completely. 2023 data showed that elderly poverty rates remained high versus other developed countries, and research explicitly links the phenomenon to generational disparities in pensions, asset accumulation, and exposure to economic growth.15 Simply put, Korea’s statistics haven’t yet entirely shaken off the final lingering cohort effects of its poorer past.16 In a cohort-composition sense, China is still several decades further behind this point.
When the Numbers Catch Up
We started by establishing how today’s aggregate statistics partly reflect a China that doesn’t exist anymore. Aggregate measures of household wealth or disposable income are arithmetically correct, but remain lagging indicators of past developmental conditions, averaged across populations that faced radically different opportunities over their lifetimes. The Korea comparison suggests it will take decades for these cohort effects to disappear entirely - at least four generations by my reckoning. Even wealthy South Korea will probably need another decade or two before those effects fully fade from its aggregate welfare indicators.
It’s thus quite reasonable to be optimistic about what welfare indicators like average wealth, income, lifespan, or consumption will look like when the average retiree belongs to the first generation raised in post-reform China (e.g., born in 1978, retired by 2038) or even modern-economy China (e.g., born in 1992, retired by 2052). If we imagine China today is roughly where South Korea was around 1996 in a cohort-composition sense, then a meaningful share of China’s remaining statistical welfare gap with richer East Asian neighbors should be set to narrow through demographic replacement over the coming decades - even in the absence of any extraordinary policy intervention.
Of course, growth will still matter most. But as China’s pre-reform and early-reform cohorts are gradually replaced by cohorts raised entirely in the post-reform world, these indicators will improve as a matter of mechanical arithmetic. Indeed, the research I linked above has already observed that Korea’s elder poverty statistics appear to be improving as wealthier cohorts enter retirement - independent from policy action by the Korean state.
In theory, this gap could be closed sooner via state transfers. In practice, that has proven to be fiscally and politically challenging. The role the Chinese state plays here strikes many as overly modest, particularly when it comes to pensions for the rural elderly, which are much lower than those for urban employees. Fiscal transfers can improve retirement outcomes substantially, establishing a floor to help ensure older populations face retirement with a reasonable guarantee of dignity, even though they never had a chance to contribute to a formal pension system in their working lives.
There is of course debate around where that floor should be - and many argue it should be higher. I tend to agree. Even after repeated increases, the national minimum basic pension under the urban-rural resident scheme is only 143 yuan per month, while average benefits remain roughly 246 yuan per month nationwide.17 But frankly, no generosity of fiscal transfers can fully offset a lifetime of unequal opportunities for education, wages, and asset accumulation. Even if pensions are beefed up, members of older cohorts will likely continue to exhibit lower wealth, income, and consumption levels than younger cohorts throughout the remainder of their lives.
This also introduces an interesting counterpoint to some of the concerns around the looming demographic cliff in China - with its old-age population expected to balloon to over 400 million people by 2040. The elderly population of 2040 will be much larger relative to the working-age population than it is today. But they will also enter their retirement with far greater resources than today’s 65+ cohort did. They will be far more likely to own urban housing and have paid into employee pension schemes. They will have spent most of their working lives in a much wealthier economy. The challenges posed by the growth China’s aging population are real, but the needs of its retirees in the future cannot simply be treated as extrapolations of the needs of the 2022 retirees - and certainly not the 2006 ones.
Demographic replacement therefore accomplishes something that redistribution policies cannot. Beyond merely transferring resources to people whose lifetime opportunities were limited, it gradually replaces those cohorts with people that never faced those limitations in the first place.
This will be reflected in the national statistics, of course, and in the practical implications for their families and the welfare state. But most importantly, it will be reflected in the quality of life for the people those statistics describe.
A small rabbit hole about definitions: The English term used in the MOHRSS data for someone who didn’t attend primary school is “illiterate”, which is the Chinese standard translation of “未上过学”. Per the Seventh National Census, this is defined as “never received any type of school education at any level”. It does not necessarily mean “unable to read” as the word is commonly understood in English. For that measure, China reports the “文盲率” (illiteracy rate, or literally “script-blind rate”) which measures the share of people age 15+ who cannot meet the national literacy standard, which requires recognition of 2000 characters for urban residents and 1500 for rural residents.
The two measures are obviously related, but not synonymous. They are both further distinct from the phrase “不识字“ which translates as “doesn’t recognize characters” and is typically neutrally used to describe someone with very minimal reading ability (often limited to a few common characters and their own name) which applies to the grandparents of many Chinese friends of my generation.
Someone who learned 500 characters in a village literacy class (扫盲班) in the 1950s likely wouldn’t be described as “不识字“ in the colloquial sense today, but would still be classified as 文盲 by today’s standards if they don’t meet the 1500-character threshold. Even if they attended a village literacy class, they would also still be categorized as someone who didn’t receive formal schooling, according to the MOHRSS definition.
The 2006 statistics are available at https://www.mohrss.gov.cn/2006/htm/0148.htm. In subsequent years, they are not posted online, but instead must be retrieved from the pages of the annual edition of the 中国人口和就业统计年鉴, or China population and employment statistical yearbook put out by China Statistics Press.
The total 65+ population in 2006, including those who were no longer considered workers, numbered some 100 million people in that year and would have likely had a higher education level on average. 65+ people who are already retired will include urban government workers, SOE staff, white-collar employees, and other kinds of professionals with pensions, all of whom would be more likely to complete primary school. The gap between age cohorts is still substantial.
Via https://finance.eastmoney.com/a/202312272945327025.html, citing the 2023 population and employment statistical yearbook.
See Yi Chen, Ziying Fan, Xiaomin Gu, Li-An Zhou, 2024. "Evaluating the effects of a massive rural school expansion in pre-reform China," Journal of Population Economics, Springer; European Society for Population Economics, vol. 37(1), pages 1-39, March.
See Footnote 4 above.
Typically, this topic comes up in commentary around China’s large cohort of people aged 50+ who are nearing retirement age, which will drastically rearrange the allocation of fiscal and social burdens for the rest of the population. It has thus become a hot topic for demographic and sociological research.
See Footnote 5 above.
China’s urban worker retirement age is 60 for men and 55 for women.
An important and related topic is the welfare gap across different regions of China. The spatial cohort gap is equally as powerful as the temporal cohort gap, if not stronger, but is not the topic of this essay. However, I would be remiss in not mentioning it at all. Modern Chinese aggregate statistics across age cohorts overstate the performance of older generations and understand the performance of younger generations, while aggregation across spatial cohorts overstates the performance of rural areas and understating the performance in cities. Like for age cohorts, this is likely part of why Chinese statisticians typically report welfare data for urban and rural areas separately.
The point here is that if China is 34 years into its economic take-off, starting from 1992, then we should look at Korea 34 years on from 1962, which is 1996. I’m aware this starting point could be debated. The correct comparison date depends on which welfare variable we’re looking at. For education and general post-Mao institutional change, 1978 is likely the most sensible starting line to define the start of reform-era China, but does not define the establishment of the modern Chinese economy. For market and pricing reforms, the mid-80s would be better. For indicators like household wealth, household income, or asset accumulation, 1992 should be best.
Consider: a person who turned 30 in 1992 spent their prime wealth-building years in the (early) modern Chinese economy, while a person who turned 30 in 1978 spent most of their prime earning years post-reform, but pre-modern economy.
Korea historical GDP data via https://fred.stlouisfed.org/data/NYGDPPCAPKDKOR
Korea: https://data.worldbank.org/indicator/SP.DYN.LE00.IN?locations=KR
China: https://data.worldbank.org/indicator/SP.DYN.LE00.IN?locations=CN
A deeper reason that the Korea comparison is imperfect is that China’s developmental transition was much more spatially uneven, especially initially. South Korea’s industrialization occurred in a country of roughly 40-50 million people, whereas China’s economic reforms had to cover a population more than twenty times larger, including vast rural, mountainous, and inland regions. This allowed South Korea’s urbanization process to be even more compressed than China’s, with its urbanization rate of ~79% in 1996 far exceeding China’s ~66% urbanization rate today.
Furthermore while China’s market-oriented reforms began in 1978 and accelerated after 1992, many of the institutions for modern rural welfare, including expanded public transfers, rural pensions, and large-scale poverty alleviation programs, only emerged in the 2000s and 2010s. This also contributes to explaining why China’s modern aggregate welfare indicators still lag what a simple cohort-composition comparison with 1996 South Korea would predict.
These topics, while fascinating, deserve their own essay, and are outside of the scope of this piece.
For the work of Seunghee Lee on elder poverty in South Korea, see: https://www.kdi.re.kr/eng/research/focusView?pub_no=18121 and https://iariw.org/wp-content/uploads/2025/02/Lee-Tokyo.pdf
Some inverse version of this phenomenon exists in the United States. Older households are substantially wealthier than younger ones, and enjoy far greater financial security on average. Here too, national aggregate statistics can obscure large cross-cohort gaps, especially for measures of wellbeing explicitly linked to income, like rates of financial precarity. Of course, a key difference is that wealthy boomers will eventually pass their resources on to later generations - if they don’t spend it all first, which many of them seem determined to do - whereas developing countries with poorer elderly populations generally have little to leave to later generations.
Per 2025 reporting from China Daily. https://global.chinadaily.com.cn/a/202512/26/WS694de591a310d6866eb3092d.html
Great insights with deep understanding of China's social structure. Just add few colors on education and productivity outlook.
One statistic makes David’s argument especially intuitive. China’s working-age population still averages only about 11.3 years of schooling, while new entrants to the labor force already average roughly 14.3 years. That three-year gap is, in large part, demographic history embedded in a national average. China does not need to “re-educate” the average existing worker from 11.3 to 14.3 years. As older cohorts educated in a much poorer China retire and younger cohorts raised under mass secondary and higher education replace them, the average will rise mechanically. In this sense, today’s aggregate education statistics partly measure China’s past rather than the human-capital level being produced by China today.
The same point also matters for productivity. China’s shrinking workforce is widely discussed; the upgrading of that workforce receives much less attention. Workers leaving the labor force are, on average, much less educated than those entering it. So even as the number of workers declines, the average human capital of the workforce can continue to rise. Higher educational attainment should support technology adoption, automation, movement into higher-productivity sectors, and the ability to operate increasingly complex industrial and digital systems. China’s demographics are therefore simultaneously a quantity headwind and a quality tailwind.
That is why I think David’s demographic-replacement argument has implications beyond education, pensions, wealth and consumption. Part of China’s future productivity growth may already be embedded in its cohort structure. National averages still contain a large statistical weight from generations formed under a much poorer China. As those cohorts are gradually replaced by generations raised entirely in the post-reform economy, China will have fewer workers—but, on average, much better-educated and potentially much more productive ones.
It’s always extremely enlightening reading your essays! You pack so much info and analysis together; it amazes me!