Did Li Keqiang really say 600 million Chinese people earn <1000 CNY a month?
No, actually...

A deep-dive essay revised heavily from a Twitter/X thread originally posted in January, 2026.
If you’ve spent any time in the China economic development space, you’ve probably heard this specific “600m” factoid tossed around.
Sometimes it comes up in earnest conversation about Chinese development outcomes. Other times it’s used more disparagingly. Either way, it’s usually delivered with total conviction, because surely the Chinese Premier knew what he was talking about, right?
Right?
Well…not exactly. It’s not that Li didn’t know what he was talking about. He was citing real data from the National Bureau of Statistics (NBS). But the statistic has been widely misunderstood, and at the time, unfortunately framed in a way that made it quite easy to misunderstand.
Let’s break it down…
Where does the “600 million” figure come from?
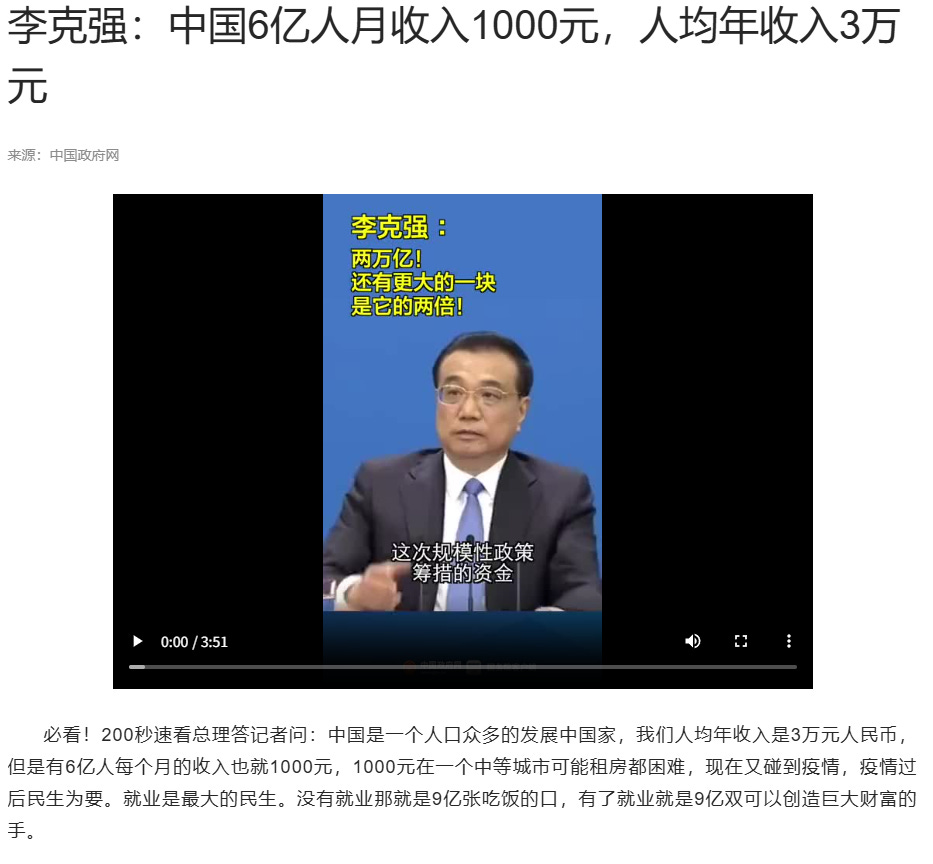
Back in May 2020, then-Chinese Premier Li Keqiang famously said in a speech:
"...人均年收入是3万元人民币,但是有6亿人每个月的收入也就1000元, 1000元在一个中等城市可能租房都困难..."
”Average annual income is 30000 CNY, but China has 600m people with a monthly income of just 1000 CNY. You’d have trouble renting in a medium city for that much.”
[my translation]
That quote immediately received a lot of attention, both within and outside of China. How could Chinese incomes be that low? That’s below minimum wage in most places. Did Li inadvertently reveal some hidden reality about widespread poverty wages?
No.
The main issue is that Li was not referring to wages at all. He was citing a cohort of household incomes averaged across people, not wages earned by individuals.
This figure comes from the bottom 40% of the population (the lowest two quintiles). It is calculated from household survey data, where total disposable income within the bottom 40% of the population is divided by the number of people in that group.
Imagine ranking every Chinese household by income, then dividing each household’s income by the number of people in it to get a per capita household income. At the bottom ranks, you’ll get many households where income is being spread across children, elderly, and other non‑earners, pulling the per‑capita figure down.
Now take just the households in the bottom 40% of the ranking. Add up all their disposable income and divide by the total number of people. That’s your number.
So why is that so confusing?
Because this measure includes everyone, not just wage earners. It includes:
Children (zero income, by definition)
Rural elderly (often minimal or no pension income)
Non-working dependents
People outcome formal employment
All these people have little or no income, pulling down the per-capita average.
When Li said “600 million people’s income is less than 1000 CNY/month”, it sounded like he was describing wages, In reality, he was citing a statistical average for a population cohort that includes tens or hundreds of millions of people with no income at all.
No wonder people misunderstood.
In fact, the confusion spread so widely that the National Bureau of Statistics had to address it directly. Its spokesperson responded to the controversy in a press briefing, clarifying what the figure actually referred to: this is a statistical average for a segment of the population, not a count for wage earners.

The Economist later wrote an article referencing this episode, which included the subhead: “China is not as poor as Li Keqiang thinks”.
They included a useful illustration:
"Imagine a country of ten people, where the bottom four earn $1, $2, $3 and $4 a day, respectively. Their income per person is $2.50. But only two of them live on less than this amount."
The Economist example is helpful in principle, although the subhead framing is unkind to Premier Li. I think he knew the meaning of the statistic, but erred by sharing it in a way that was likely to be misunderstood.
Compared to the Economist example, the effect is even more pronounced for China, because of the sheer number of people with little or no formal income.
Li’s wording didn’t help
So why WAS it so widely misunderstood? In my view, the biggest driver of confusion was Li's framing comment:
“You’d have trouble renting in a medium city for that much.”
With this line, he likely meant to accentuate the hardship of being in a lower economic quintile. But his framing implicitly invites the reader to interpret the number as individual income vs. cost of living (i.e., a wage).
In reality, Chinese household incomes include multiple earners, rural families have subsistence resources and often don’t pay rents at all, and disposable income excludes in-kind benefits and social transfers. So this comparison really invites the assessment to go in the wrong direction…
[Also, as an aside, but you can rent for 1000 CNY a month in lower-tier cities. Not in Shanghai or Beijing, obviously. But not impossible.]
So what’s the actual number?
If we instead ask precisely: “how many individual people actually have disposable income below 1000 CNY/month”, we’d have to make an estimate:
According to NBS data, in 2020 the lowest-income 20% of the population had an average monthly disposable income of 655 CNY/month. Almost the entirety of this cohort of 280m people falls under the CNY 1000/month threshold.
Next, the lower-middle 20% had an average of 1370 CNY. Let’s conservatively say that half of them are below 1000 CNY/month. So that’s another 140m people
We don’t have within-quintile distributions, so any estimate here is necessarily rough. But this estimate yields ~420 million people (30% of the population).
What about today?
Looking at the 2024 NBS data:
By 2024, the lowest-income 20% was still averaging just CNY 795/month. The growth is appreciable, but it’s still low. Low enough that I’d think about everyone in this quintile is still below the 1000 CNY threshold.
Over the last five years, disposable income growth for the low-middle 20% has been the fastest across all 5 quintiles. By 2024, it reached 1800 CNY monthly, implying far fewer people under the 1000 CNY threshold. So how many exactly…?
Again, same caveat about not having within-quintile distributions. But if we try to keep our guesses conservative, guess perhaps another ~70m people in this quintile crossed the 1000 CNY monthly barrier. So in 2024 there were around 350m people (or ~25% of the population) below 1000 CNY/month. Still a large number, but not the common “600 million wage earners living on poverty wages” interpretation. Importantly, most of them are children, elderly, farmers, and informal workers, not formal wage earners earning below the minimum wage.
What should we take away from this?
Chinese wages aren’t as low as the meme suggests. And this cohort-based averaged per capita statistic isn’t even meant to describe absolute incomes. It’s most useful as a measure of inequality and relative development levels. It shows us:
Large parts of the country still have very low formal incomes
Income distribution is uneven, evidenced by cross-quintile gaps
Even as it grows rapidly, China remains a developing country (which of course was part of Li’s intent in sharing this statistic in the first place)
In my view, the most important structural issue highlighted here is the low rural pensions, which affect ~180 million elderly people and obviously drag down the disposable income averages substantially. Likely the most meaningful policy pathway to improving low incomes in the bottom two quintiles is just to bolster rural pensions. Not that this is necessarily simple or straightforward to do in practice, but I hope it illustrates the kind of thinking you’re able to participate in when you grasp what the statistic is actually measuring - and what it means for Chinese stakeholders.
Understanding this makes all the difference.
Educational dave, thanks
Understanding this explains why China loves building expressways, high speed rail and power plants….infrastructure increases opportunity.